Tips and Tricks in ECG Diagnosis
A 25 year old male with retrosternal pain and tightness
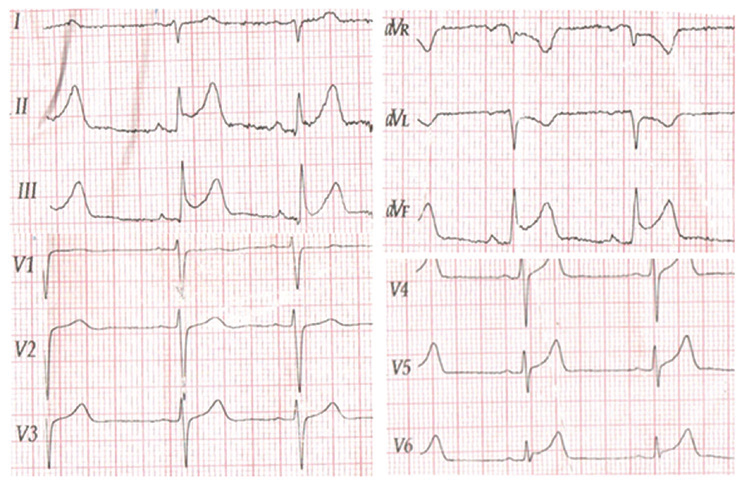
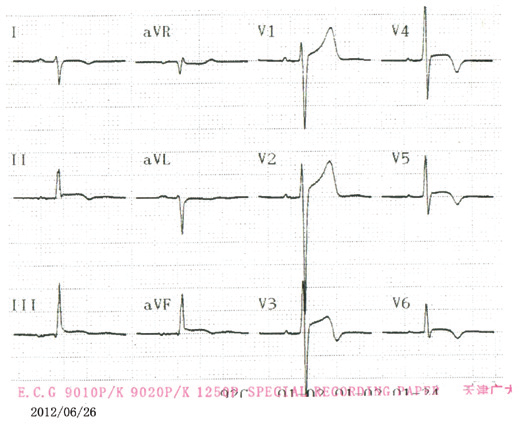
A 25 year old male was admitted with acute retrosternal pain and tightness that had persisted for >3 hour. No history of hypertension or diabetes or family history of heart disease was reported, and the patient never smoked cigarettes or drank alcohol. Physical examination showed that his blood pressure was 120/70 mmHg, tempera¬ture was 37.2˚C and heart rate was 63 bpm. First and second heart sounds were normal without any audible murmurs, rubs or gallops. Of note were the signs of ST segment elevations in leads II, III and aVF on the electrocardiogram (ECG), suggestive of myocardial ischemia. An echocardiogram showed that the patient's heart functioned normally with an ejection fraction of 63%, excluding the possibility of mitral valve prolapse syndrome. The patient immediately underwent coronary angiography, which showed normal epicardial coronary arteries. After three days his temperature started fluctuating between 35.5 and 38.4˚C. Scattered small red dots appeared on his feet, and the rash further expanded to his arms and legs 2 days later. A standard 12 lead ECG on the third day showed that the elevated ST segment in the II, III and aVF leads began to fall back, coupled with T wave inversion. The Tn1 level increased to 8.470 ng/ml.
Q. What is the diagnosis?
Discussion
In the present case, the patient had typical retrosternal pain, elevated cardiac markers and electrocardiographic ST T changes on admission, and was initially diagnosed with acute myocardial infarction; however, emergency coronary angiog¬raphy demonstrated normal coronary anatomy. In addition, in the week following admission the patient presented with a flu like illness manifesting as slight chills and fever. His cardiac enzymes subsequently decreased and the ST segment elevation gradually decreased. Other unique characteristics of myocarditis in this case were the temperature fluctuations and the rash on the patient's arms and legs, which appeared later during his hospitalization. It is likely that the typical clinical presentations of myocar¬dial infarction, such as chest pain, ST segment elevation and incremental serum markers, appear in patients diagnosed with myocarditis. Physicians should take into consideration several lines of evidence, such as clinical presentation, ECG alterations and cardiac enzyme changes, prior to making a diagnosis. Myocarditis may share similar ECG changes with myocardial infarction. TnT, TnI and creatine kinase (CK) MB are the most commonly used cardiac biomarkers. Cardiac Tn is mainly elevated in the acute phase of myocarditis and decreases gradually as the patient improves. ST segment elevations in the II, III and aVF leads on the ECG, accompanied by acute retrosternal pain and elevated cardiac markers, led to the initial incorrect diagnosis of myocardial infarction. Clinical manifestations, including a fever with temperature fluctuations and the appearance of a rash on the arms and legs, coronary angiography and the results of auxiliary examinations, could aid in the differential diagnosis between acute myocarditis and myocardial infarction.
Source: Experimental and Therapeutic Medicine. 2015; 10: 459-464
A 30 year-old woman with severe retrosternal chest pain, radiating to back
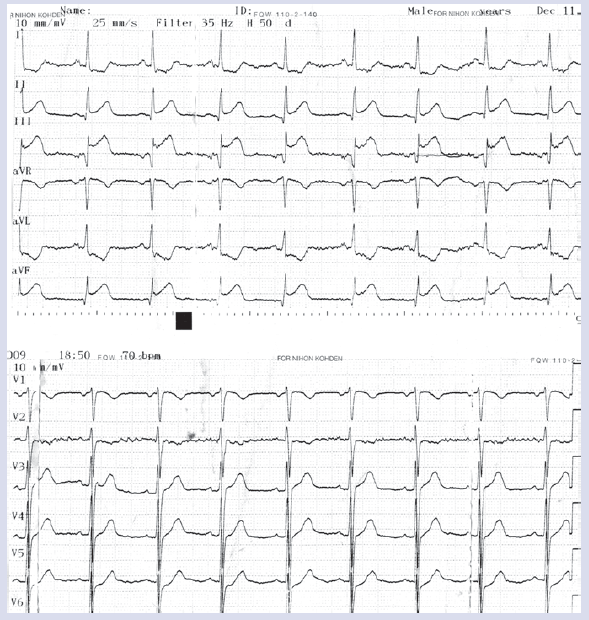
A 30 year-old woman was admitted with moderate to severe retrosternal chest pain, emerging six hours before, radiating to back. The pain had an acute onset, progressive course and a compressing nature. She perceived no changes in the quality of pain with position or on inspiration. Cardiac examination revealed normal S1, S2, with no additional sounds, murmurs or pericardial rub. Electrocardiogram (ECG) on admission revealed sinus rhythm, normal QRS axis, a Q-wave at leads II, III, aVF and ST-segment elevation at leads II, III, aVF with reciprocal ST segment depression at leads I, aVL. Results of initial cardiac enzyme tests revealed serum troponin I of 8.5 ng/mL (normal < 1 ng/mL), creatine kinase (CK) of 272 U/L (normal 20–150 U/L), and CK-MB of 32.8 IU/L (normal < 25 IU/L).The laboratory investigations were otherwise normal except for elevated WBC (17200/mL) and ESR (68 mm/h). There was no evidence of pericardial thickening or effusion. The chest pain and ST elevation persisted despite sublingual and intravenous nitroglycerin administration.
Q. What is the diagnosis?
Discussion
The prevalence of myocardial involvement in influenza infection ranges from 0% to 11%, depending on the diagnostic criteria used to define myocarditis. A few case reports and series represent the incidental diagnoses of influenza-associated acute myocarditis with the pandemic 2009-H1N1 influenza A virus infection, but the true prevalence remains unknown. This is a report of acute myocarditis mimicking acute myocardial infarction associated with the 2009 pandemic influenza A virus (H1N1) infection. There are many case reports of acute myocarditis mimicking acute myocardial infarction. A thorough and detailed history, examination and ECG interpretation is mandatory in this situation to avoid complications that may arise from inaccurate diagnosis. Despite a low cardiac risk score supportinga diagnosis of myocarditis in this patient, the localized dramatic inferior ST-segment elevation and segmental left ventricular dysfunction raised the possibility of an acute coronary syndrome. Differential diagnosis often requires cardiac catheterization. Diagnosis in these kinds of patients is difficult, as they may not have an acute coronary syndrome. A diagnosis of myocarditis needs to be kept in mind. Unfortunately, the clinical diagnosis of myocarditis remains a challenge owing to the non-specific pattern of the clinical presentation and the lack of universally accepted and standardized diagnostic criteria.
Source: Cardiol J. 2011; 18(5): 552–555
A 37-year-old female with acute onset of upper abdominal pain
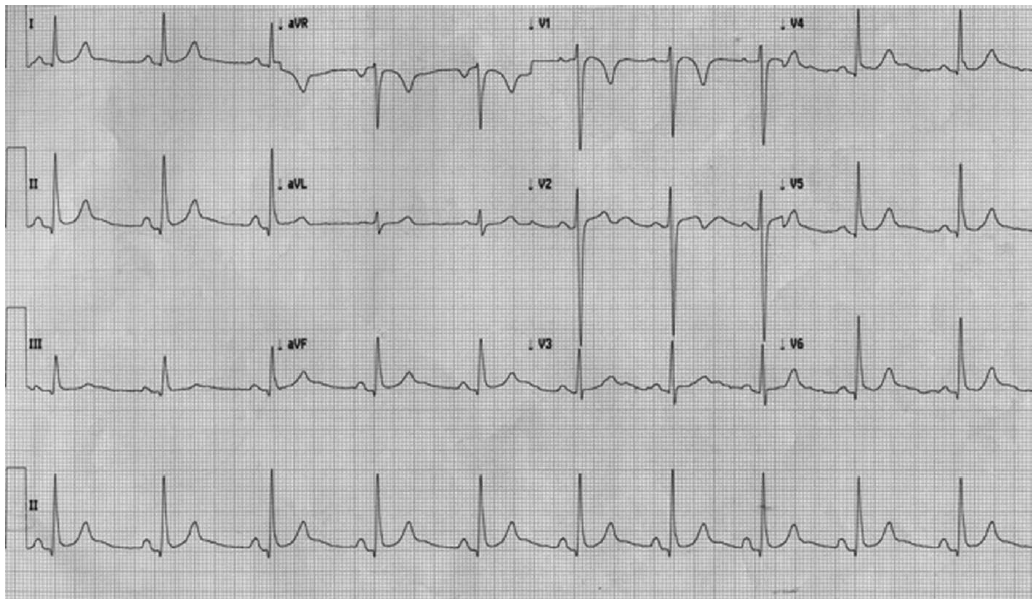
A 37-year-old female with a body mass index of 39 was referred with acute onset of upper abdominal pain. It was of sudden onset with one-day duration. She was awakened with severe, cramping, colicky abdominal pain that started on both sides of the posterior thorax and migrated to the epigastric region. She was bradycardic at a regular 45 beats per minute and a blood pressure of 150/70. Cardiothoracic auscultation revealed a grade III pansystolic murmur and vesicular breath sounds throughout. Examination of the abdomen elicited tenderness in the epigastric and right upper quadrant region with localized peritonism. Gallstones and an inflamed gallbladder were seen on ultrasound. The patient’s ECG revealed a sinus bradycardia with 1-mm ST segment elevation in leads V5, V6, and aVF, and 2-mm ST-segment elevation in leads II and III. In view of the unexpected ECG findings. The patient was initially managed conservatively on the Acute Coronary Syndrome (ACS) protocol. A repeat ECG after 30 minutes showed some resolution, but 30 minutes after that showed persistent ST-elevation in the lateral leads. Troponin I levels obtained both on admission and 12 hours later were noted to be negative (<0.02ng/mL).
Q. What is the diagnosis?
Discussion
This patient had epigastric and right upper quadrant abdominal pain with clinical features suggestive of acute cholecystitis but associated ST-segment elevation in the distribution of the circumflex and right coronary arteries on ECG. Initally, this prompted treatment under the ACS protocol with therapeutic anticoagulation using low-molecular weight heparin. A laparoscopic cholecystectomy for acute cholecystitis was carried out that led to a full resolution of the patient’s ECG changes. Acute inflammatory and ulcerative conditions involving the gallbladder or duodenum cause irritation and spasticity of surrounding structures. This can create reflex stimuli through autonomic pathways to restrict or alter the coronary blood supply, maybe such that existing minor deficiencies in the coronary circulation become manifest. It is possible that acute upper abdominal disease can prematurely reveal subclinical changes in the coronary circulation. The alterations in the ECG could have been caused by temporary myocardial ischemia, since the changes disappeared. Gallbladder distension has been shown to increase heart rate, arterial blood pressure, plasma rennin levels, and studies in animals suggest that its effect on coronary blood flow may be a significant factor underlying these ECG changes. A diseased gallbladder has been associated with changes in the ECG similar to those of ischemic heart disease.
Source: JSLS. 2011; 15: 105–108
A 22-year-old female with abdominal and retrosternal pain
A 22-year-old female patient was brought to emergency department with complaints of pain abdomen, vomiting, and retrosternal chest pain of acute onset. Abdominal pain and chest pain were dull aching in character and were not related to any known precipitating factors. She was known to have CKD and was on maintenance haemodialysis since 3 months. Laboratory values revealed: hemoglobin 8.3g/dL; total leukocyte count 13,100 cells/ mm3; neutrophils 80%. Blood urea nitrogen 40 mg/dL; serum creatinine 9.1 mg/ dL; random plasma glucose 120 mg/dL; serum sodium 146 mEq/L; and serum potassium 7.7 mEq/L. Antistreptolysin O titers, troponin I levels, and calcium were within normal range. Arterial blood gas analysis showed pH 7.20; PaO2 109 mm Hg; PaCO2 55 mm Hg; bicarbonate 16.2 mEq/L. ECG showed left axis deviation, secondary STT changes and tall T waves in chest leads. A 2D-echocardiogram was unremarkable. Chest radiograph showed mild cardiomegaly with normal lung fields.
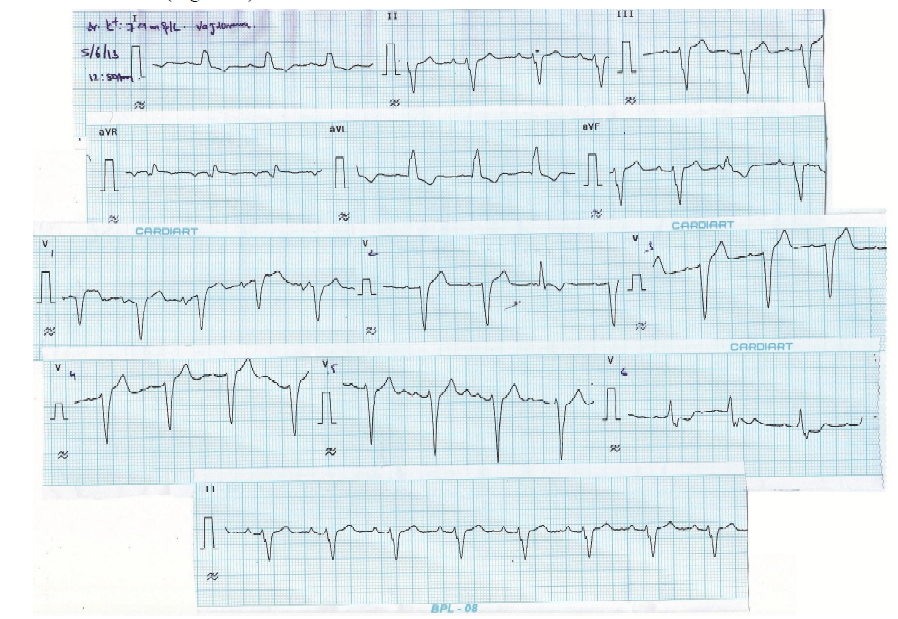
Q. What is the diagnosis?
Discussion
Hyperkalemia, defined as serum potassium >5.0 mEq/L, is a common metabolic disturbance with potentially life threatening consequences. Electrocardiogram (ECG) may provide the first evidence of hyperkalemia, but patient-to-patient variability is high. Even though most common ECG findings in hyperkalemia include peaked T waves and widened QRS complexes, hyperkalemia can cause several characteristic abnormalities which are often progressive. Poor correlation has been observed between serum potassium levels and any specific ECG finding and the sensitivity of ECG for diagnosis of hyperkalemia is poor. Bundle branch blocks in hyperkalemia are atypical in the sense that they involve the initial and terminal forces of QRS complex. Shifts in the QRS axis indicate disproportionate conduction delays in the left bundle fascicles. As hyperkalemia progresses, depolarization merges with repolarization, expressed in the ECG with QT shortening and apparent ST segment elevation simulating acute injury. This disappears with haemodialysis dialyzable current of injury. The hyperkalemic ECG changes range from peaked T waves, loss of P waves, prolonged QRS complex, ST elevation, escape beats and escape rhythm to sine wave, ventricular fibrillation, asystole, axis deviations, bundle branch blocks, and fascicular blocks. Usual order of appearance of ECG changes is tall T waves, QRS widening, loss of P wave, ST elevation with “pseudo infarction” pattern, sine wave and eventual asystole. ECG changes of hyperkalemia are frequently consistent at higher levels of serum K+ (≥7.8 mEq/L) and often progressive. Among hyperkalemic ECG changes, conduction blocks are infrequent and also LBBB is rare compared to RBBB.
Source: J Clin Sci Res 2015;4: 159-63.